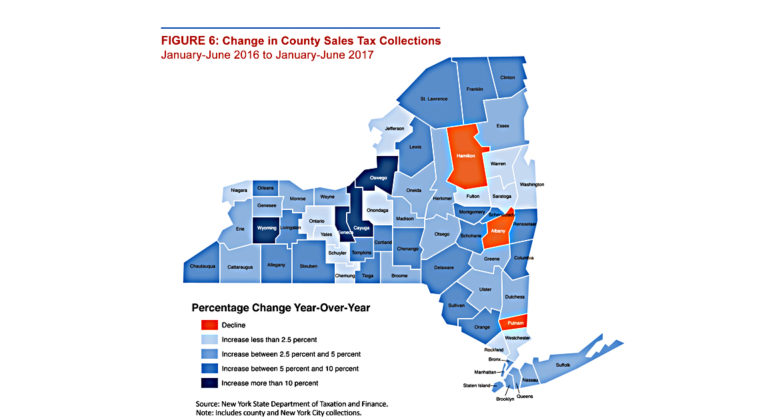
Image source: Office of the New York State Comptroller, First Half of 2017: Local Sales Tax Growth Ticks Up Statewide
As a New Yorker, you hear a great deal about taxes. All the annoying ones: property taxes, income taxes, corporate taxes, and the one with no escape– sales tax. Sales tax, the dreaded eight cents that made you sad you did not have enough money for the candy bar that you wanted as a kid. Or, made you question how to calculate the tip when you go out to eat (I always do 15% – 20% post tax for the record). In either case, it is one of life’s greatest annoyances, while also being a critical source of municipal revenue and an important indicator of spending within a region.
For the past few weeks, I have spent a great deal of time looking at the sales tax revenue collected here in Cayuga County and during that time I have become interested in several things. Mainly, the overall revenue generated within the County, how much it has changed over the last few years, the industry sectors that generate the most revenue for us, and which sectors have had the largest overall increase the last couple of years.
First, a little background for those that are unfamiliar with where that annoying $0.08 comes from. The total sales tax rate in any given location can be broken down into state, county, city, and special district rates. New York State has a 4% sales tax and Cayuga County collects an additional 4%, so the minimum sales tax rate in Cayuga County is 8%. In other words, for most purchases $0.08 gets added onto every dollar you spend, with $0.04 going to Albany and $0.04 staying right here in Cayuga County. This is why it is so vitally important to support our local businesses.
I began by gathering information generated by the NY State Department of Taxation, available at https://www.tax.ny.gov/research/stats/statistics/sales_tax_statistical_reports_open_data.htm. The available data looks at the 2013 to 2017 tax years. For sales tax purposes, the collection year runs March – February.
Overall, revenue for the State in the 2016/17 tax year (meaning March 2016 through February 2017) was $317,694,781,765 and of that, $1,077,292,118 was generated by Cayuga County businesses. Statewide, revenues were 2% higher than 2015/16 totals, and in Cayuga County increases were 3% higher during the same period. While any increase in revenue is a positive sign, the statewide increase was smaller than previous years when it was 4% in both the 2014/15 and 2015/16 tax years. In Cayuga County however, the 3% increase realized in 2016/17 is a rebound from the previous tax year where revenues declined by 3%. Additionally, the 3% increase in Cayuga County was much stronger than that of both Chautauqua and Madison Counties, two counties with similar income ranges and populations. These counties realized relatively stagnant growth, -.38%, and .75%, respectively.
What industry sector had the largest impact on the revenues collected in Cayuga County? Not surprisingly, the Retail Sector is the largest contributor to revenues, representing approximately 57% of the total collection in 2016/17. Retail includes businesses such as automobile dealerships, gas stations, department stores and other retailers that deal in small quantities and trade directly with the public. Statewide, you see this same trend with retail serving as generally the largest driver of revenues, with the sale of automobiles being the largest contributor.
The next largest contributors within Cayuga County are the Utilities Sector and Accommodation / Food Services Sector. Combined, these two sectors represent nearly 20% of all revenues collected. The Utilities Sector, which includes the generation and transmission of power and water along with sewer services, is that hidden fee in your NYSEG bill. The Utilities Sector in Cayuga County has seen the largest increase in revenue generation since the 2013/14 tax year, increasing by greater than 50%. It is difficult to tell what has driven this increase.
The Accommodations/Food Services Sector consists mainly of hotels and restaurants. In Cayuga County, revenues from this sector are 12% higher than they were in 2013. This is lower than the state increase of nearly 19%, but much stronger than Chautauqua and Madison counties at 7.5% increases. The influx of popular restaurants and drinking establishments into downtown Auburn over the last several years has certainly contributed to this increase, and with the increased popularity and awards coming into the region, this is a trend likely to continue.
In general, Cayuga County is trending upward in the generation of sales tax revenues across many different sectors. The Manufacturing Sector, which made up slightly higher than 3% of county revenues, includes the manufacturing of everything from aerospace products to craft beer, and has seen a 22% increase since 2013. Beverage manufacturing alone has increased by nearly 19%.
What, then, do these numbers mean? They mean that more people are doing business here in Cayuga County. In total, revenues are 4% higher than they were in 2013/14. And according to the New York State Comptroller’s Office (https://www.osc.state.ny.us/localgov/pubs/research/local-sales-tax-growth-2017.pdf), sales tax collection in Cayuga County in the first half of the 2017 calendar year is up over 15% compared to 2016. More people are coming into the County and doing business, which is good for every county resident. The more money that is spent locally supporting local businesses, the greater the level of revenue generation for the county to provide the services that everyone depends upon.
Joseph Sheppard is Economic Development Technical Specialist at CEDA. Contact him by calling (315) 252-3500 or email jsheppard@cayugaeda.org.
Published in the August 31, 2017, edition of The Citizen.


